Why Traditional Spreadsheets Pivot Tables Crash on Large Datasets — and What Actually Works
5/19/2026
Problem
Sales teams, finance departments, and operations managers all face the same recurring task: summarize large datasets by categories. Total revenue by product, order count by region, average handling time by support agent. In traditional spreadsheets, this is done with Pivot Tables.
Pivot Tables work fine on small datasets. But the moment you try to group 5 million rows, traditional spreadsheets freezes. The progress bar shows "Calculating PivotTable... Row 1,048,576 / 5,000,000" and then the application stops responding entirely.
The practical workaround is either to pre-filter the data to a smaller range (risking incomplete analysis) or to write Python code with pandas groupby (which requires coding knowledge and environment setup).
Why It Happens
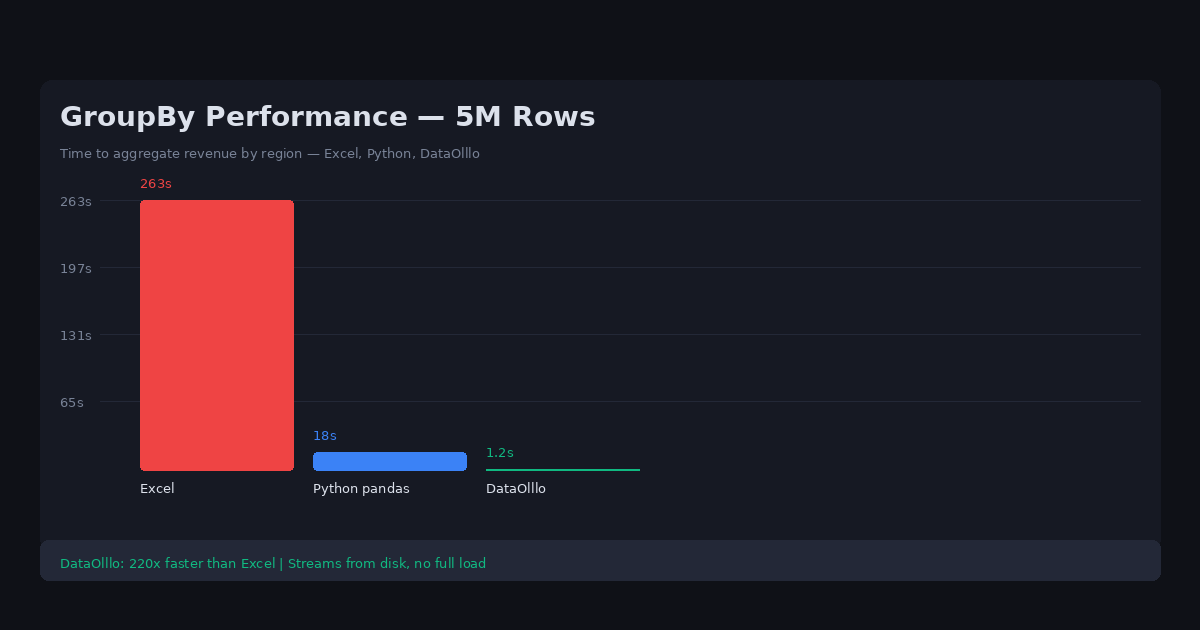
Traditional spreadsheets Pivot Table engine recalculates all aggregations in memory every time you change a filter or drag a field. On a 5 million row dataset, this requires processing all 5 million rows on every interaction, which can consume 10GB+ of RAM and take minutes per operation.
Power Query helps with data transformation but adds complexity and still requires manual steps. SQL can handle this efficiently but requires database setup and SQL knowledge.
Spreadsheets are fundamentally single-user, single-machine tools — they weren't designed for large-scale aggregation at the speed analysts need.
Practical Workflow
-
Open your large CSV or traditional spreadsheets file in DataOlllo — whether it's 1 million or 10 million rows.
-
Select the columns you want to group by (e.g., Product Category, Region, Sales Rep).
-
Choose aggregation functions — Sum, Count, Average, Min, Max. Apply multiple aggregations to different columns simultaneously (e.g., Sum of Revenue AND Count of Orders).
-
Apply multi-level grouping — group by Year, then by Region, then by Product Category, just like a pivot table but without the lag.
-
View results instantly — aggregation on 5 million rows completes in seconds, not minutes.
-
Export the summary table to CSV or traditional spreadsheets for your reporting tool.
Directory Mode Instructions
If you receive recurring large datasets that need the same aggregation applied each time (e.g., weekly sales reports, monthly financial summaries):
- Save your aggregation workflow as a named view
- Use Directory Mode to process new files with the same structure
- DataOlllo applies the same group-by logic to each new file automatically
This turns an hour of manual pivot table work into a one-click repeatable operation.
Common Aggregation Functions by Business Need
| Business Need | Group By | Aggregation | Example Output |
|---|---|---|---|
| Revenue by region | Region | SUM | APAC: $2.4M |
| Order count by rep | Sales_Rep | COUNT | John: 847 orders |
| Avg deal size | Stage | AVG | Negotiating: $12K |
| Inventory by SKU | SKU | MIN (stock) | SKU-123: 12 units |
| Response time | Service | MAX (latency) | auth-svc: 340ms |
DataOlllo applies multiple aggregations simultaneously -- SUM, COUNT, AVG, MIN, MAX in a single operation.
When to Use DataOlllo
Large-scale aggregation is one of DataOlllo's strongest capabilities.
Relevant capabilities:
- Instant aggregation — group by multiple columns and apply multiple aggregations simultaneously on datasets with millions of rows
- No-code — no SQL, no Python, no pivot table freeze
- Local processing — aggregated reports stay on your machine
- Multi-level grouping — group by Year > Region > Product Category in a single operation
The spreadsheet pivot table was designed for datasets with thousands of rows. DataOlllo's aggregation engine handles millions without performance degradation because it processes data on disk rather than loading everything into RAM.
Next Step
Try the GroupBy solution page for more aggregation workflow examples.