The 10-Minute Weekly Workflow: How to Combine Shopify Sales and Facebook Ad Reports to Find Your True Profitability
10/31/2025
The 10-Minute Weekly Workflow: How to Combine Shopify Sales and Facebook Ad Reports to Find Your True Profitability10/31/2025 #DataOlllo#Shopify#WorkflowAre you spending hours every week in traditional spreadsheets manually trying to combine Shopify sales reports with your Facebook ad data? It’s a frustrating, slow process — especially when your CSVs are massive, your traditional spreadsheets file keeps crashing, and your VLOOKUPs never seem to match the right columns. Even after all that work, you’re still not confident about your real ROAS or net profit. If that sounds familiar, this guide is for you. You’ll learn how to stop wasting hours merging spreadsheets and instead build a 10-minute automated workflow that shows your true ad profitability — every week, in just one click.
Why Manually Combining CSVs in traditional spreadsheets is Wasting Your Money
Let’s be honest: traditional spreadsheets wasn’t built for modern e-commerce data. When you export your Shopify order data and Facebook Ads performance reports, you’re usually dealing with tens of thousands of rows, multiple date formats, and different naming conventions. Each week you:
- Import new CSVs from both Shopify and Facebook
- Try to align metrics like spend, revenue, orders, and ROAS
- Manually filter out test purchases or refunds
- Spend hours debugging broken formulas The result? You lose time you could spend optimizing campaigns — and your profitability insights are often outdated by the time you finish.
The 5 Steps to Manually Calculate Ad Profitability (The Hard Way)
If you’ve been doing this in traditional spreadsheets, you probably recognize this routine:
- Download Shopify Sales Reports — usually “Orders Export” or “Sales by Product” CSVs.
- Export Facebook Ad Performance Reports — with columns for Spend, Clicks, Purchases, ROAS, etc.
- Clean and Format Data — remove extra columns, fix dates, and rename fields so VLOOKUPs can find matches.
- Merge and Match — combine datasets manually using formulas or pivot tables.
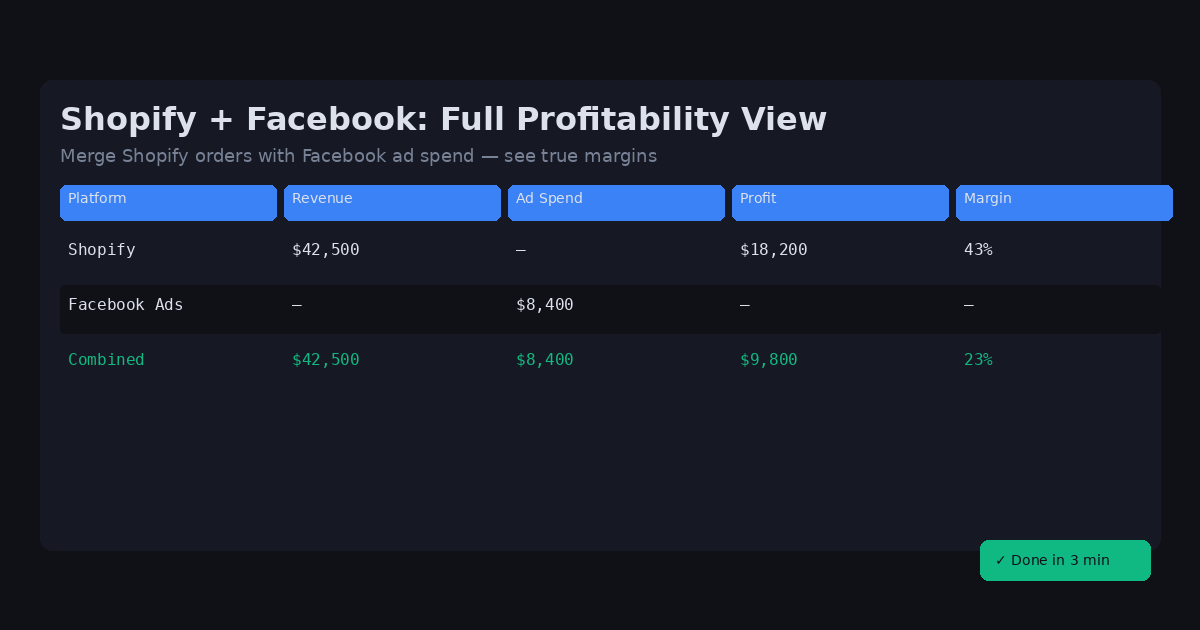
- Calculate Profitability — subtract ad spend from net sales and cross-check against your Shopify dashboard. This process is fragile and slow — and the more campaigns you run, the more complicated it becomes.
A Better Way: The 1-Click Workflow That Does It For You
Here’s the good news: you can now do all of that automatically using DataOlllo, a desktop workflow tool built for data automation — no coding required. With AI assistant, workflow recording, and one-click rerun, you can automate your entire weekly reporting process and get your profitability insights in under 10 seconds.
Step 1: Open Your Shopify and Facebook Reports
Start by selecting both your Shopify and Facebook CSVs: Click “Open File” → Select shopify_sales.csv and facebook_ads.csv together. Both datasets will load into DataOlllo for analysis.
Step 2: Ask the AI Assistant to Calculate Profit, Income & Outcome
Click the AI Assistant button to open the chat window. Then follow these steps: Ensure both datasets (Shopify and Facebook) are selected. Type your request, for example: “Please help me calculate the profit, income, and outcome of each campaign for each month.” The AI will generate the exact pandas code needed to merge your data and calculate profitability. Review the sample result that appears below. If everything looks correct, click “Apply All” to run it on your full dataset.
Step 3: Visualize Profitability with an Interactive Chart
Now, select the new generated DataFrame from the sidebar. In the AI chat window, type: “Use bars to display income, outcome, and profit for each campaign in each month.” The AI will generate Plotly code to create a grouped bar chart showing monthly performance per campaign.
- You can click the chart to open it in your default browser.
- It’s interactive, so you can hover, zoom, and even download it directly.
Step 4: Save the Workflow for Future Reports
Once you’re happy with the workflow, scroll below the AI chart and click “Save Workflow”. Give it a name — for example: Shopify_Facebook_Profit_View DataOlllo will remember all the AI steps and transformations.
Step 5: Reuse Your Workflow Next Week — Instantly
Next week, when you download new reports, you don’t need to repeat the process. Just click “Workflow” on the top toolbar → choose Shopify_Facebook_Profit_View → select your new CSVs — and DataOlllo will automatically rerun the entire workflow in seconds. No need to retype commands or rebuild charts.
Real Results: From 2 Hours to 10 Seconds
Shopify sellers using DataOlllo report cutting their weekly reporting time by 90%. No more broken formulas. No more traditional spreadsheets crashes. Just real numbers — every week, on time, in one click.
Ready to Try It?
Get your 10-minute weekly profitability workflow set up today with DataOlllo. Download the desktop app, connect your Shopify and Facebook CSVs, and see how easy it is to automate your data flow — right on your computer, with no cloud uploads. Try DataOlllo Now — Register for 7 days pro free