Stop Writing Scripts to Parse Logs: Filter Production Errors Visually
5/29/2026
The Problem
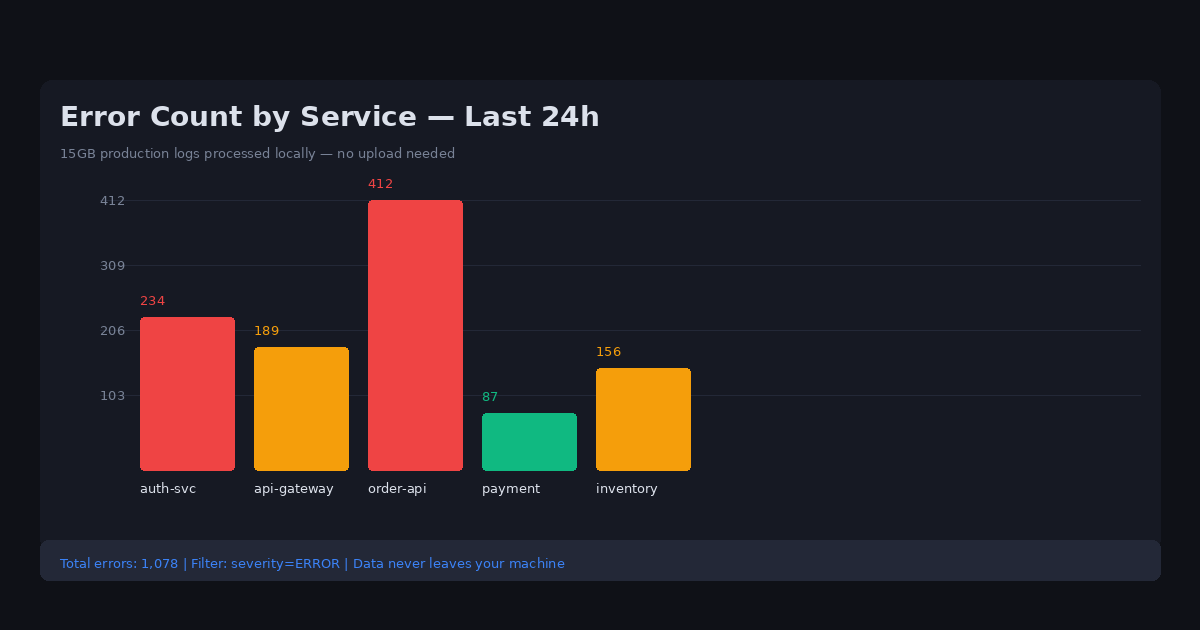
Production logs tell you everything about how your system behaves — until you try to actually read them. Modern distributed systems generate JSON logs that can be tens of gigabytes per day. A single production incident might generate 15GB of log data across hundreds of services.
The standard developer workflow is: SSH to the server, pipe the log file through grep, awk, and sed to extract relevant lines, curse when the awk syntax is wrong, fix the regex, re-run, wait five minutes, realize you missed a column, adjust, wait again.
By the time you've extracted the information you needed, an hour has passed and the incident may have worsened.
Cloud log platforms (Datadog, Splunk, New Relic) handle this well but require shipping logs to their infrastructure — which means your production data, including user IDs, session tokens, and request payloads, all sit on a third-party system.
Why This Happens
JSON log files are nested and variable-schema. A log entry might include timestamp, service name, request ID, user ID, error type, error message, and stack trace — all in a structure that differs between services. Parsing this manually with shell tools requires writing and debugging regular expressions for each query.
Even if you write a Python script to parse logs, loading a 15GB JSON file into memory crashes most development machines. Streaming parsers work but require coding.
The alternative (cloud log platforms) solves performance and usability but introduces data sovereignty issues: sensitive PII in log data, internal API endpoints, and user behavior patterns all reside on vendor infrastructure.
Step-by-Step Workflow
-
Download the relevant log files from your log aggregation system or directly from the server for the incident window.
-
Open the log file in DataOlllo — a 15GB CSV or JSON file loads in seconds using DataOlllo's streaming processing.
-
Apply visual filters — filter by error code (Status == 500), service name, time range, or any combination using the filter panel.
-
Use AI Chat to ask: "Find all null pointer exceptions in the auth service from the past hour, grouped by user session"
-
Group by session or request ID to trace the sequence of events leading to a crash.
-
Export the filtered incident timeline as a CSV for post-mortem documentation.
Automating This with Directory Mode
If you're analyzing logs from multiple services or rotating log files:
- Place all service logs in one folder (or organize by date)
- Open in Directory Mode — DataOlllo handles multiple log files from different services simultaneously
- Apply the same filter criteria across all logs
- Compare error rates or patterns between services
This is significantly faster than running separate grep commands on each log file.
Common Log Field Names by Platform
| Platform | Timestamp | Level | Service | Message |
|---|---|---|---|---|
| JSON (custom) | timestamp | level | service | message |
| Apache | time_iso | level | host | request |
| Nginx | time_local | level | server | message |
| Syslog | timestamp | SYSLOG | program | message |
| CloudWatch | @timestamp | log.level | log.name | @message |
DataOlllo auto-detects column structure from JSON and CSV log files -- no schema definition needed.
When DataOlllo Is the Right Tool
Developer log analysis is a natural fit for local processing.
Relevant capabilities:
- Large log file handling — open multi-GB log files without streaming or chunking
- Local privacy — sensitive production data stays on your machine, no third-party log platform required
- Visual filtering — filter by error codes, service names, and time ranges without writing regex
- No Python required — stop writing throwaway parsing scripts for every incident
The key advantage is immediacy: instead of waiting for grep to scan a file line by line, DataOlllo's indexed filtering gives instant results on files of any size.
Get Started
See the Developers solution page for more log analysis workflows.